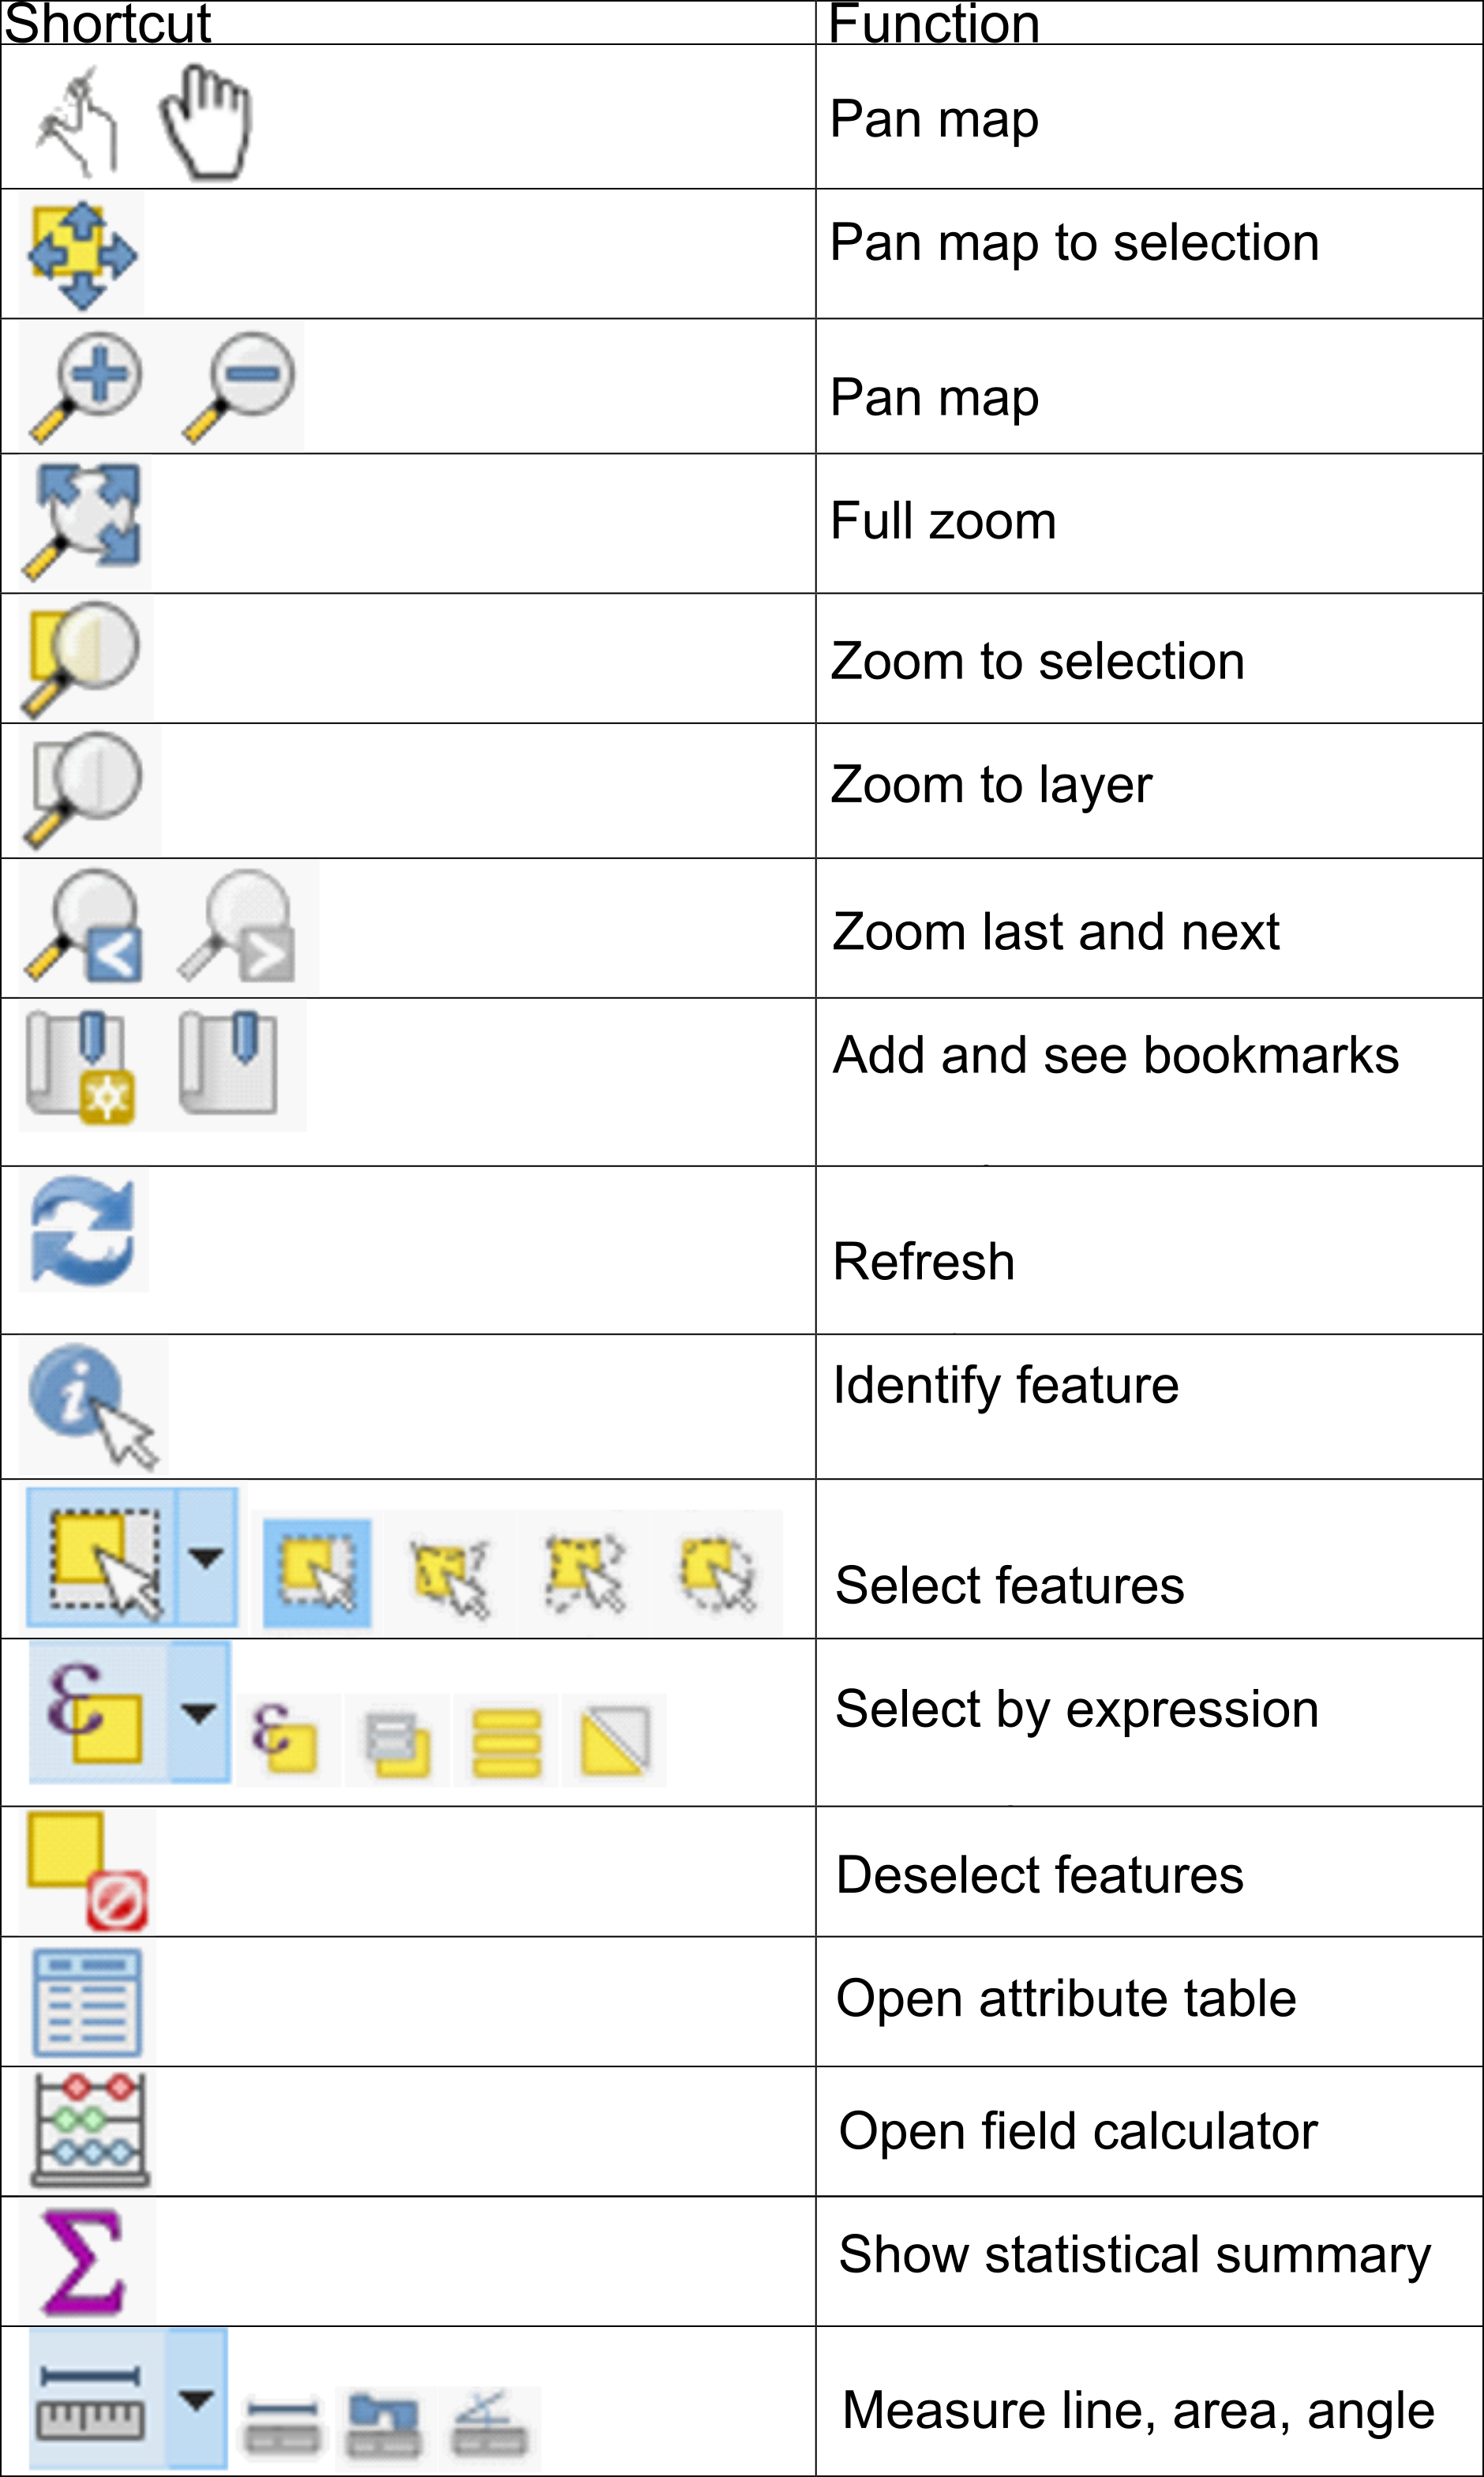
The basic tools for data display, visualization and navigation are located in the Map Navigation toolbar:
The basic tools for viewing attribute information are located in the Attributes toolbar:
The following table describes the shortcuts for data visualization and display:
The description of the data display is located at the bottom of the interface showing the project coordinate system, the position coordinates and offering scale, magnification and rotation settings.
Visualization of data is both technical and artistic. The basis is the knowledge of content and technical procedures, which in the next steps, with design, need to be upgraded with creativity.
The uploaded data is displayed hierarchically. Their display level can be set in the layer management toolbar. The hierarchy of the display runs from the top Layers Panel. The upper layer covers the lower ones. In the example below, we can see an example of displaying and overlapping different vector data (point, line, and polygonal).

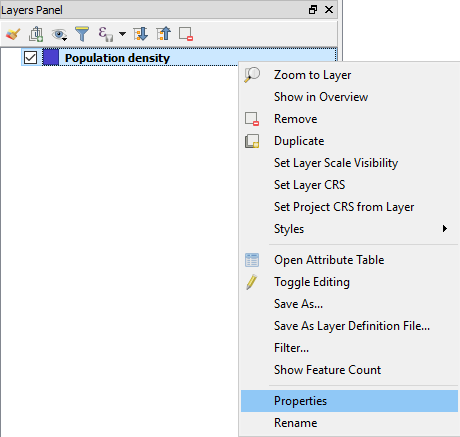
By right clicking on the desired data, we get prompted tools, whit which we can set up layer proprieties, display settings, style format and data storage settings. We access the Layer Proprieties by clicking on Properties or simply by double-clicking on the name of the layer. It is important that we realize that edited data style is stored and defined only within our QGIS project (file * .qgs). This means that input data are unchanged and that their visualization will be generic in other projects / programs.
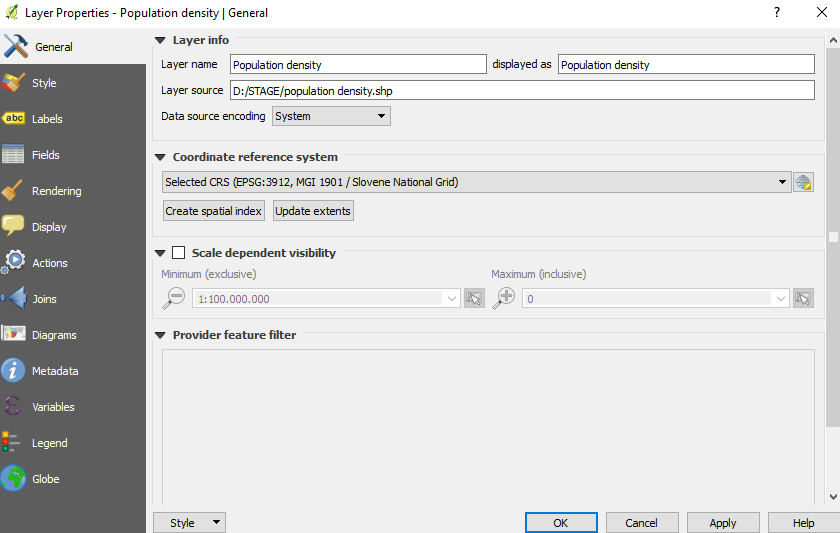
In the Style tab, we have various tools for style editing.
We can choose several display types in which we can change the fill style (color, symbol / hatch), borders (color, type, node style, thickness) and transparency of the display:
- single symbol: the entire layer is displayed in the same way;
- categorized: the layer is categorized by the defined column in the attribute table;
- graduated: the layer is categorized by the defined column in the table and the defined value intervals; intervals of values can be classified by equal intervals, quantiles, natural breaks (jenks), standard deviation and pretty breaks.
- rule-bases additional advanced tools for categorizing data and displaying them
- inverted polygons (for polygons only): display areas which are the geometric inverse of our polygons
- 2.5D display (for polygons only): display data with 2.5D effect
- heat map (for points only): type of display, I'm looking at the density distribution of points
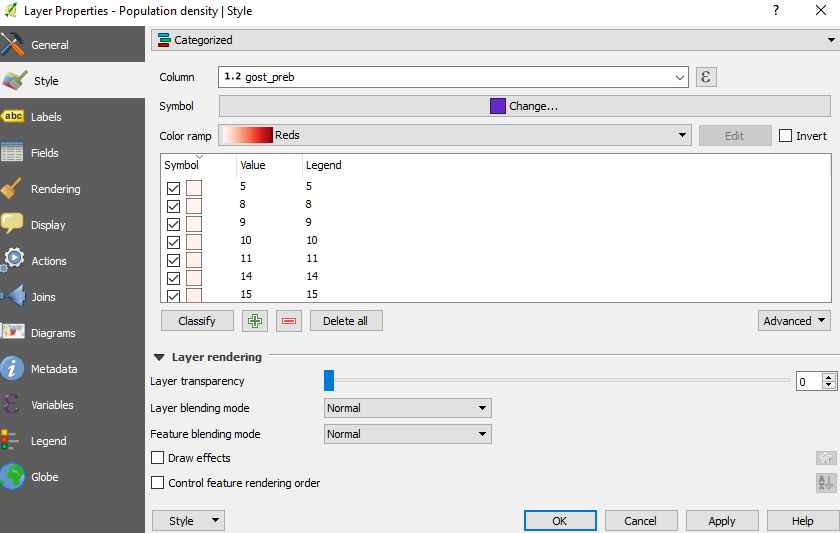
Example of style categorising:
- Double click on the name of the layer and go to the style
- Select the mode
- Define a column whit the values the that will be categorized (in our case gost_preb, which represents the population density)
- Choose a that suits us
- Classify the data into categories
- Apply the changes
In case that we want to apply a functional classification mode, we set up the style in Graduated mode. E.g. of setting a graduated style:
- Double click on the name of the layer and go to
- Select the
- Define a column whit the values the that will be categorized (in our case gost_preb, which represents the population density)
- Choose a that suits us
- Select the for ta (number of and classify the data into categories)
- Apply the changes
In case that we want to apply a functional classification mode, we set up the style in Graduated mode. E.g. of setting a graduated style:
- Double click on the name of the layer and go to
- Select the
- Define a column whit the values the that will be categorized (in our case gost_preb, which represents the population density)
- Choose a that suits us
- Select the for ta (number of and classify the data into categories
- Apply the changes

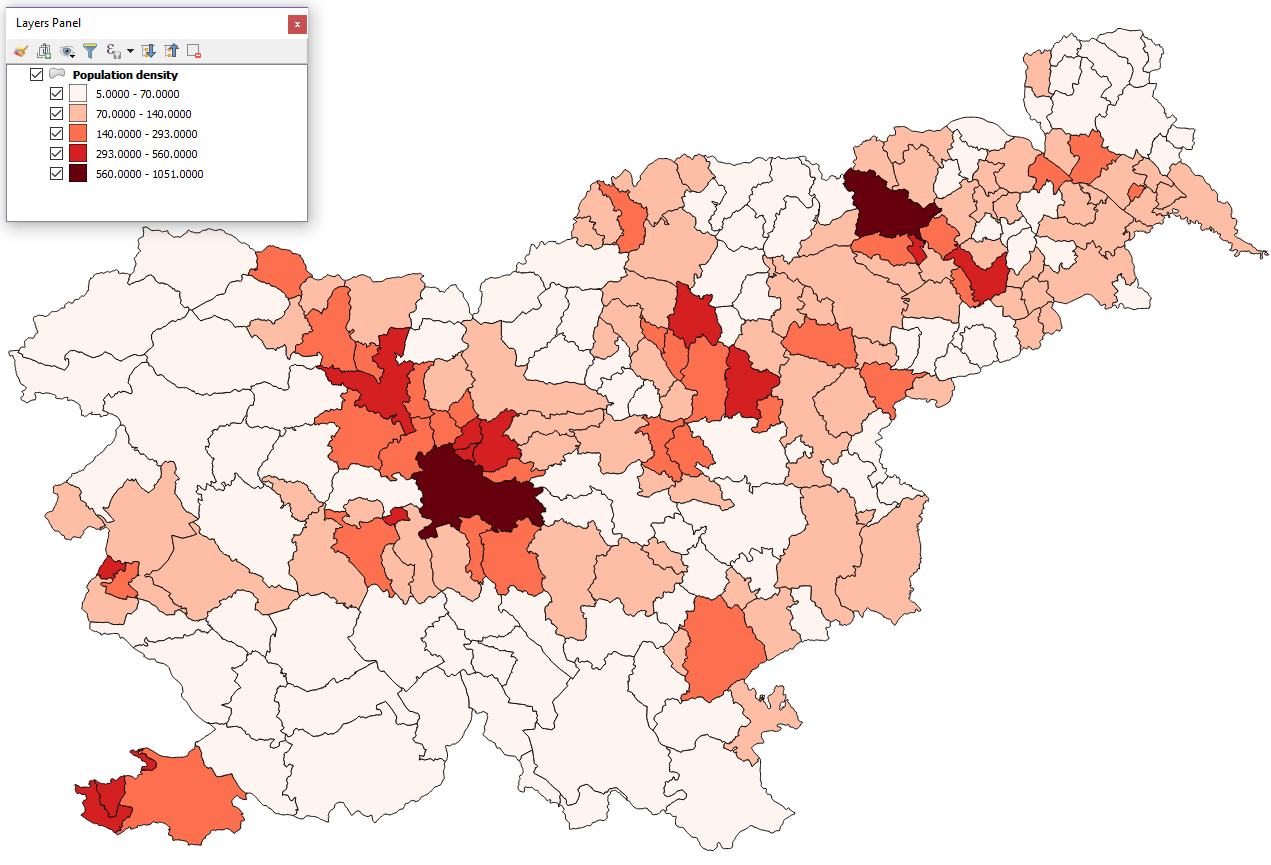
All the additional design depends on creativity.
In the chapter Thematic Cartography and print composing, we will show you how to make a map ready in the QGIS Print Composer.