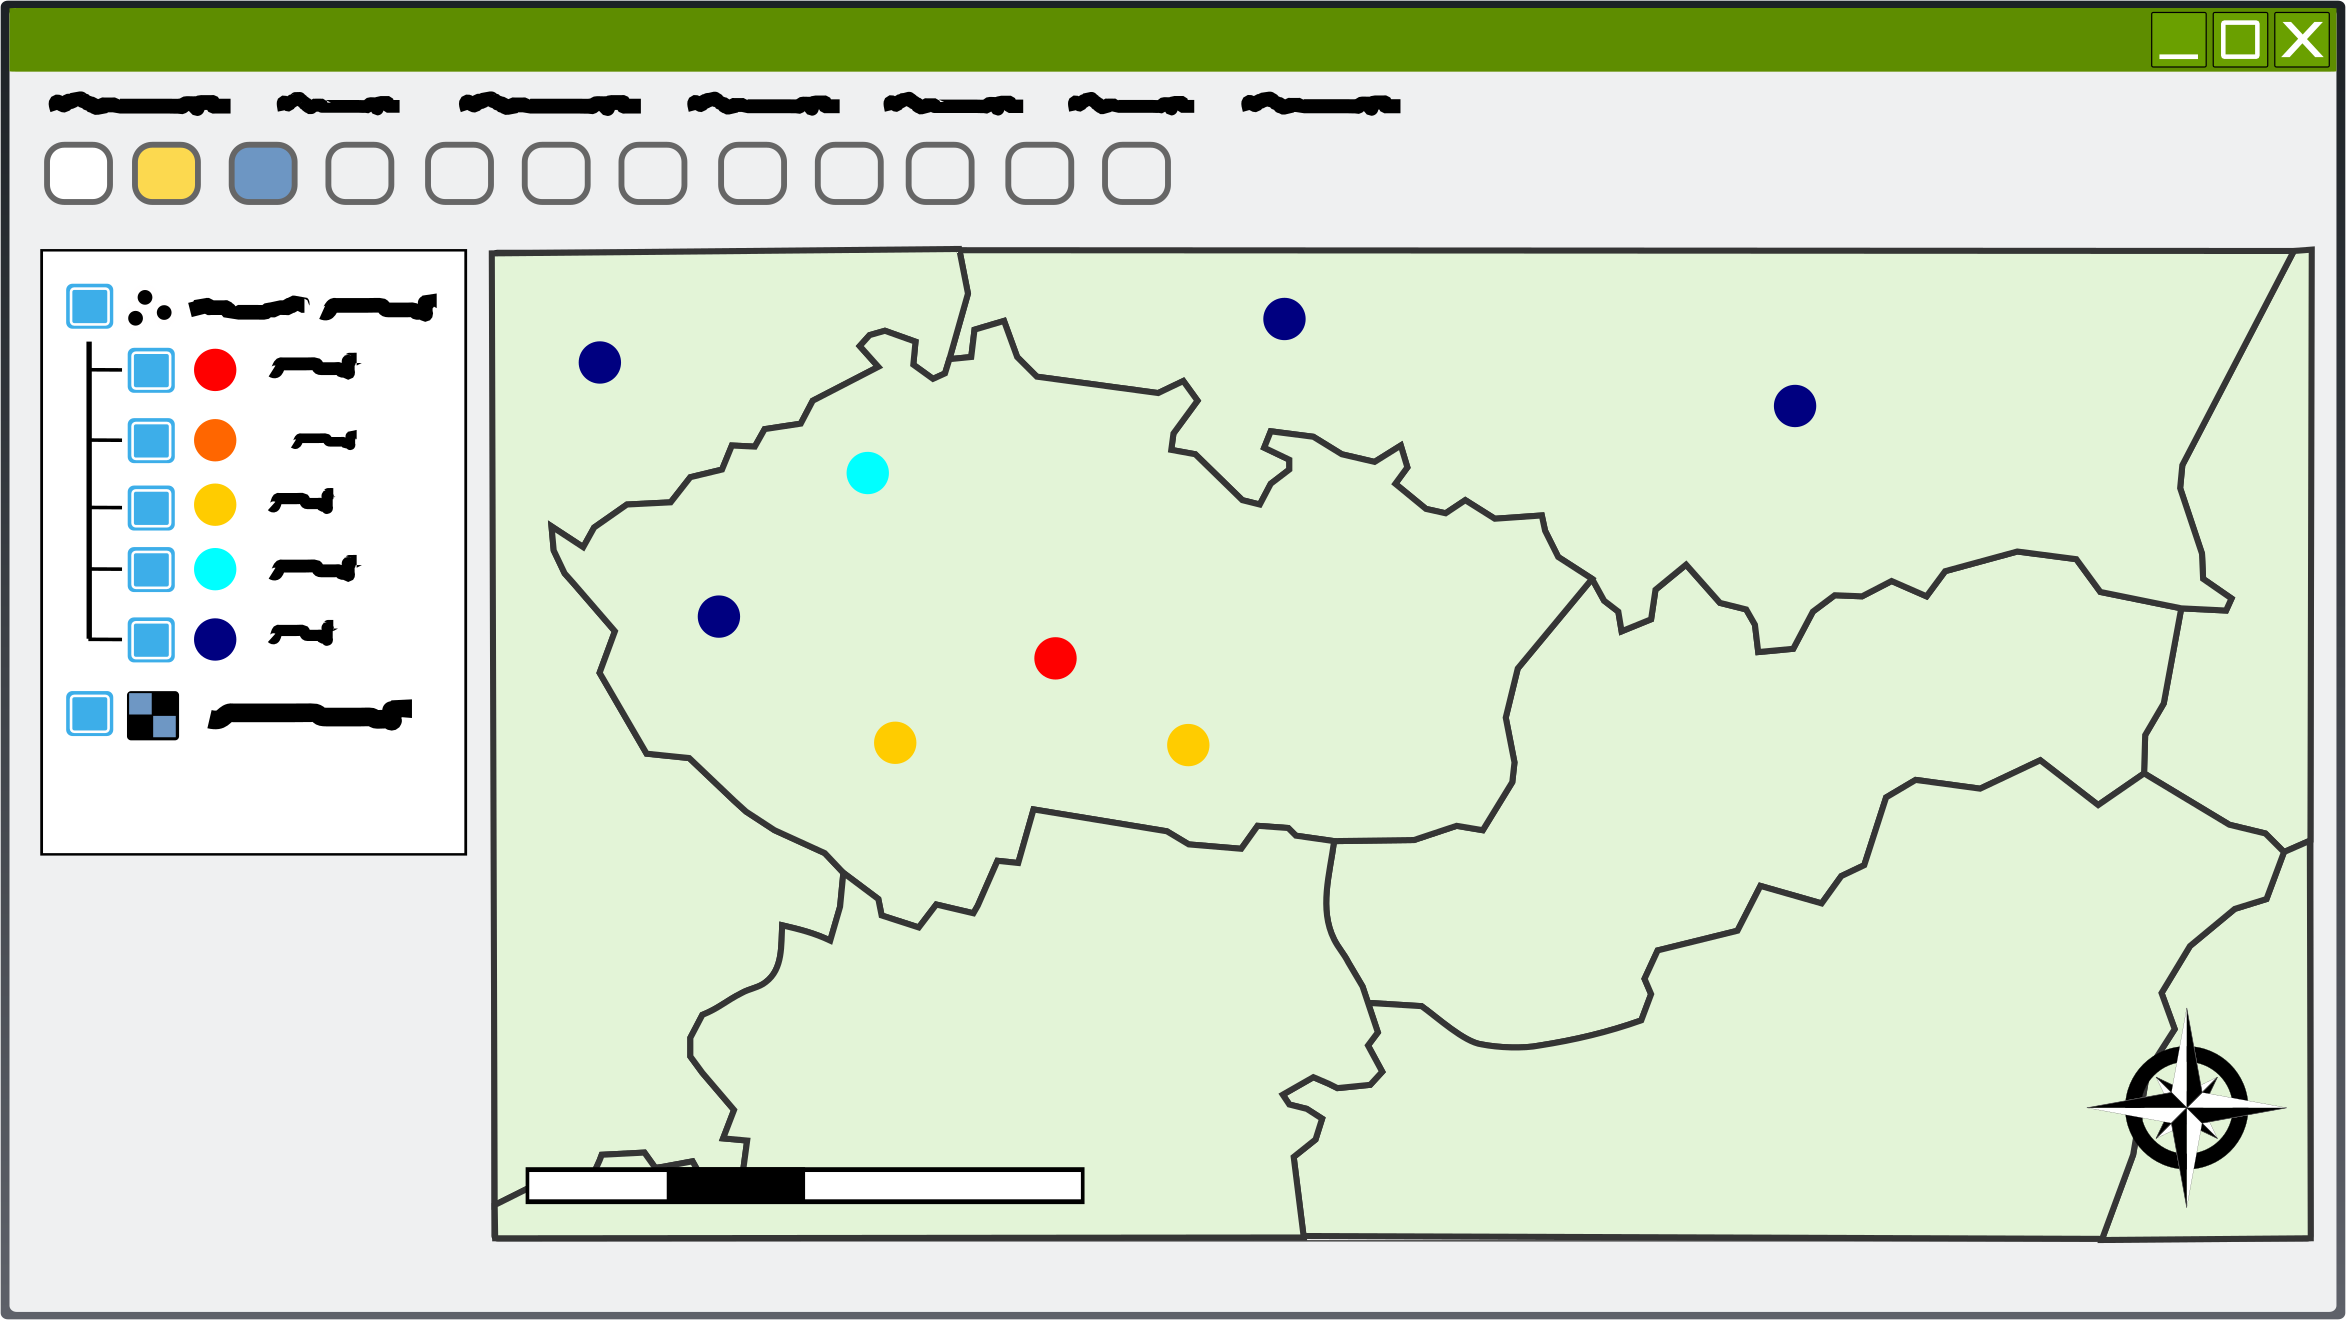
The general digitization of data, which covered every field in the last decades, also covered the field of spatial data. The need for digital storage, processing and visualization of spatial data was reflected in the development of geographic information systems (hereinafter referred to as GIS). High-performance GIS platforms for spatial data processing have been developed, and various standards for the distribution and visualization of spatial data have been created for appropriate standardized file formats parallel with the development of the Internet.

According to the means of visualisation, processing and storage technology, spatial data is divided into vector and raster Spatial data consists essentially of a geometric representation of a particular area (or area attributes) in a given coordinate system. The geometric representation can be supplemented with attribute data that determine the value (eg, the attributive table of shapefiles) or formed with a set of pixel values that together describe one raster image (e.g. an image, a digital surface model).
In today's sea of software solutions, we can meet various GIS platforms such as QGIS, ArcMap, GRASS, gvSIG,SAGA and a variety of specific à la carte web solutions like STAGE II, OpenStreetMap, PPGIS, airport maps, etc.

All the data provided by STAGE II can be exported, imported, visualized and processed into GIS. In the Education Corner we will present the use of geospatial data using the QGIS tool, because it is a strong, reliable and open source GIS tool. This means that you can install it for free and follow our instructions easily.
The basic concepts of geoinformation processing are the same as in other tools, so you are certainly invited to test other access tools according to your needs and requirements.