Geospatial data has a time component, which is essential for analysing the situation in the context of changes and trends.
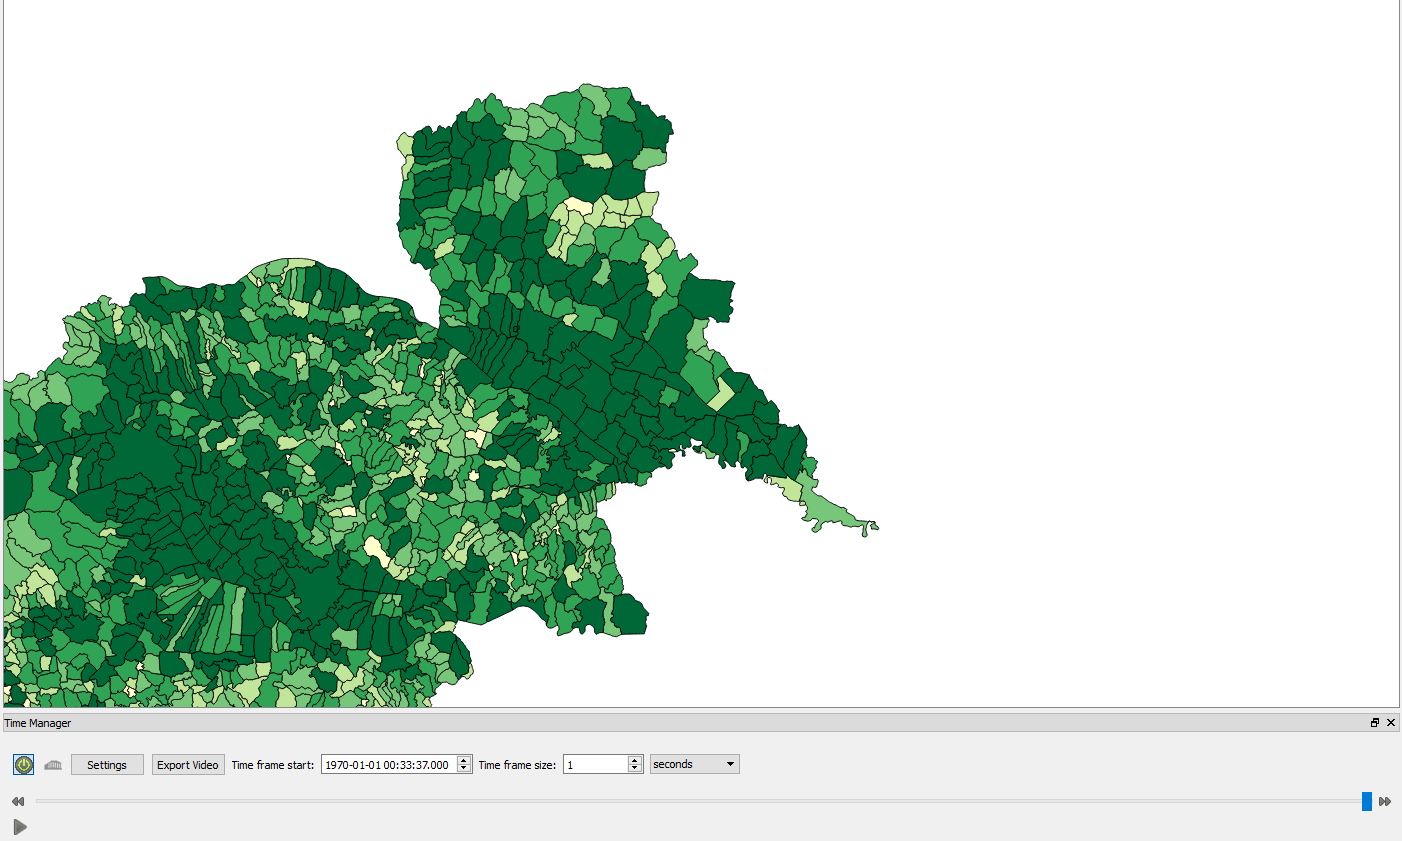
STAGE II enables the display of animations of time data sets. GIS tools allow you to display time series sets and also calculate time series. If we need a video of time changes (for example, for use in a presentation), we can create an animation of time changes in QGIS using the TimeManager plugin.
If we are interested in calculating time series, magnitude quantification, and plotting time series in graphs, we can use the Temporal / Spectral Profile Tool plugin. We first rasterize the geospatial data and then use the plugin to perform the analysis.
From STAGE II, we downloaded data of the number of population (settlements) for the period from 2008 to 2017. To create an animation, we have to define a time component for the vector layer by defining it in a column in the attribute table. We launched batch process and assigned the time component for each layer.
We gave classified the layer style (graduated, 5 equal intervals).

Animations can be exported as GIF or video.