Case study 2:
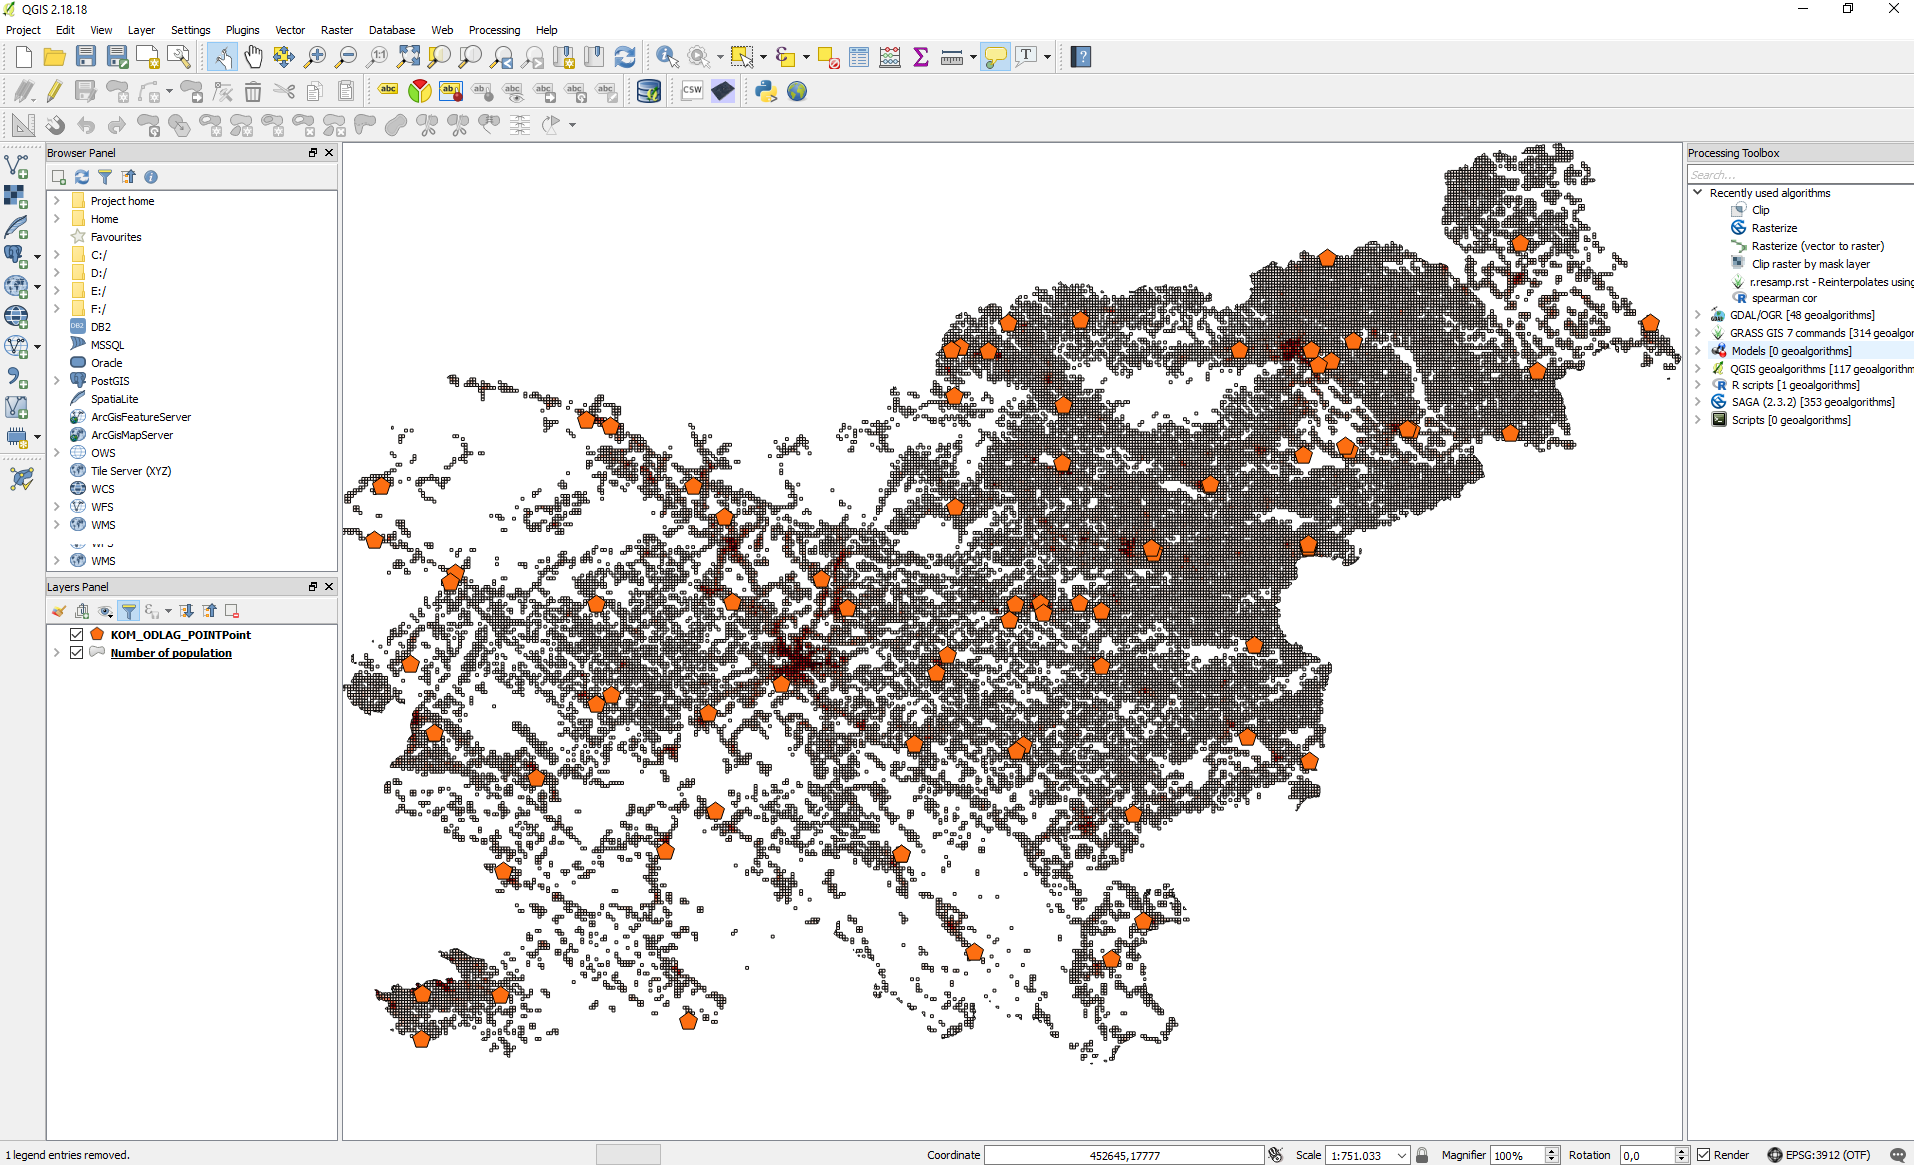
In the study case, we analyse the situation in the proximity of municipal landfills.
Do we have populated areas in Slovenia near municipal landfills?
In order to get the answer to the question, we started to download data:
- Number of population - grid 500 m, 2017 (STAGE II)
- Municipal landfills (points) (Geoportal ARSO)
After the download, we extract the data and import it into QGIS.

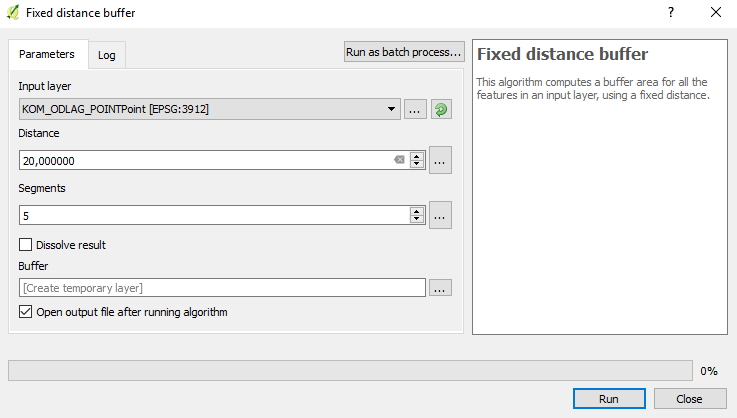
The next step is to carry out a spatial join of points that represent municipal landfills and vector grid of population numbers. In order to ensure that we do not filter landfills that are not directly overlapping the vector grid, but are also in the proximity, we will perform a spatial join of a 20-meter buffer of points and the vector grid. The buffer layer is generated with the Fixed distance buffer tool.

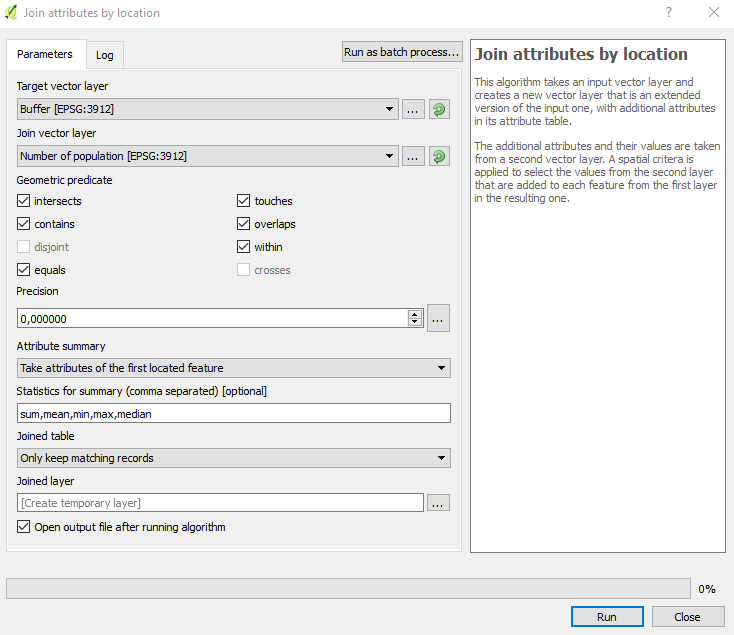
In order to obtain the areas that overlap with the vector grid, we used the Join attributes by location tool. We defined the input layers and the geometric predicates.

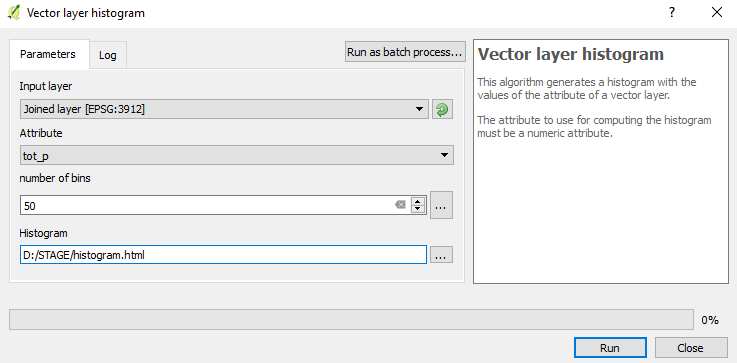
We found that 43 of 79 municipal landfills are located in a populated area. In order to understand the distribution of the population, a histogram was computed (Processing Toolbox -> Vector layer histogram).


From the histogram we read that most areas in the vicinity of municipal landfills have less than 100 inhabitants. In the calculation tool  we calculated that the median is 14 inhabitants. We are interested i there are landfills that deviate significantly from the mean. From the histogram we can immediately see one that has approx. 250 inhabitants in the surrounding area and one with approx. 550.
We marked all municipal landfills with more than 200 residents. The selection was exported (the process described in Case study 1) and the elements were intersected with a layer of settlements to locate the landfills.
After the intersection we see that the landfills are located in the area of two settlements: Slovenian Javornik and Vrhnika.
In the end we visually checked the results to interpretate their accuracy.